You can now view your AB test results in unprecedented detail, marking key moments in your experiment and comparing your conversion rates to changes in your page’s traffic. The new Convertize results page incorporates three innovative features that make your data easier to analyse and interpret. Together with the A/B testing Smart Editor and Traffic Autopilot, this update makes Convertize the most user-friendly A/B testing tool available.
Make Sense Of AB Test Results Instantly
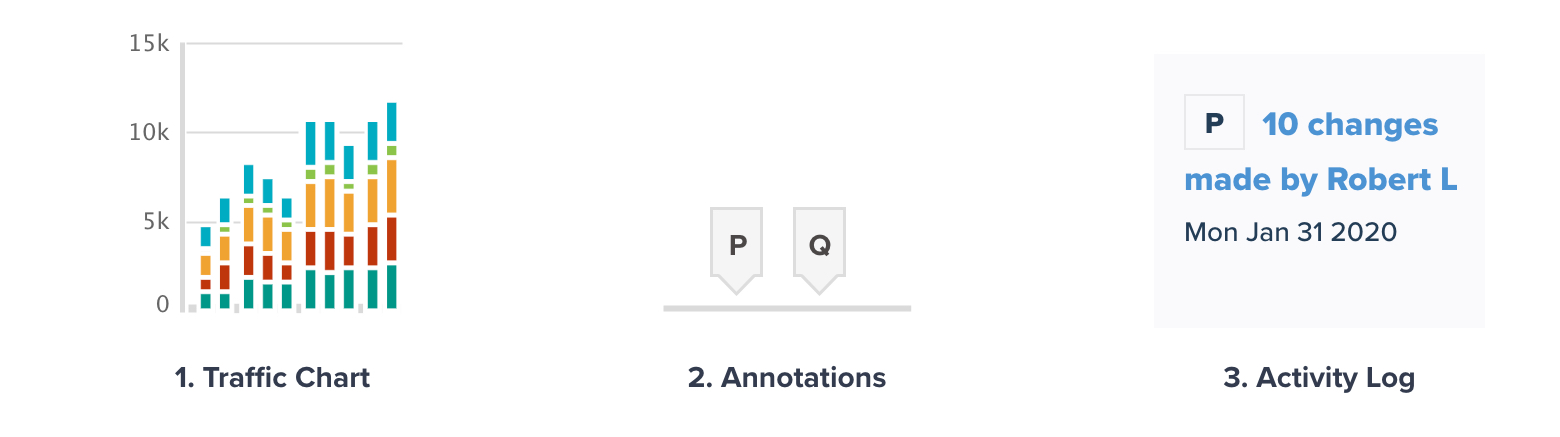
A/B testing can be unpredictable. Because of that, you need to be able to track your experiments as easily as possible. The new Convertize AB test results page incorporates three new features to make sure you always know what is happening in your experiments:
But, before we explain what these features are, this is why we redesigned our much-loved results page…
Imagine you’re responsible for a business website and you want to optimize a page with A/B testing. Two weeks into your experiment, the marketing team announces a new advertising campaign that will increase your page hits and change who visits your site. When you try to interpret your results, they’re going to look a bit strange – so you need to add a note to your data to explain any unusual behaviour.
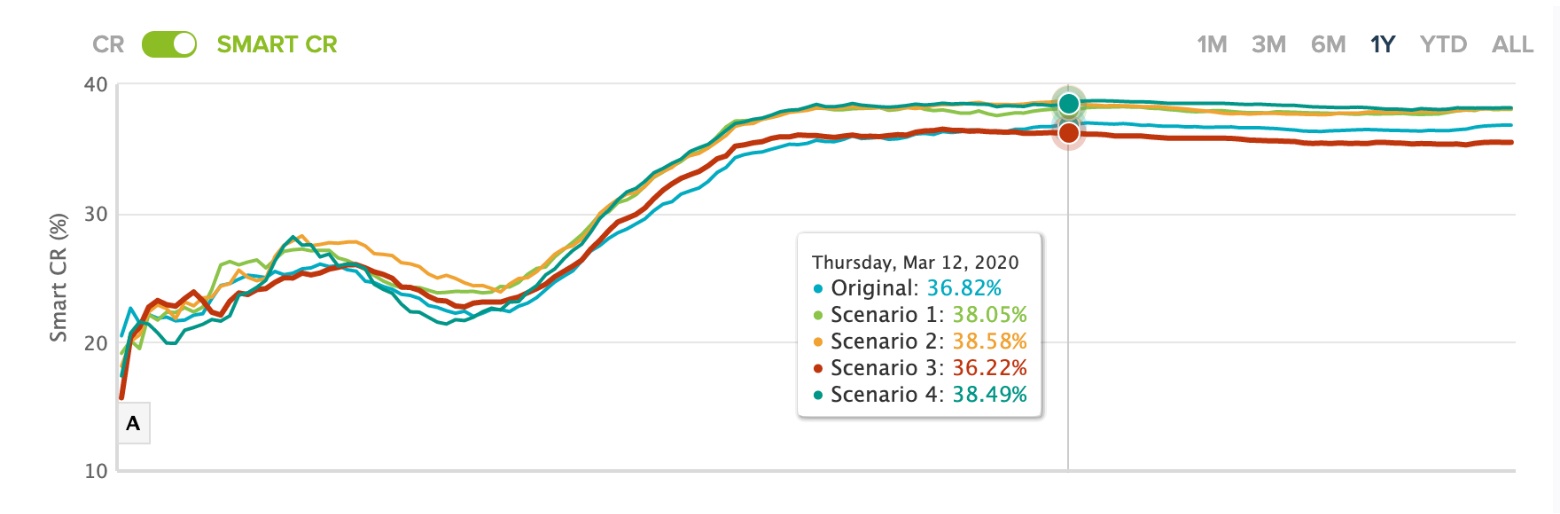
Or, suppose you notice that the conversion rate for one of your scenarios has changed suddenly. You could be losing conversions, so you need to work out what has happened. To help you do that, you need a results page that shows you each scenario’s conversion rate, as well as your page’s total traffic, for each day that the experiment has been running.
These kinds of situations occur all the time when you’re optimizing a website. That means you need your A/B testing tool to give you more information than a simple line graph provides. Working with A/B testing statistics can be a challenge, so we have created the most versatile and transparent AB test results page possible.
Changing the settings for your experiment whilst it’s running, or adding an entirely new scenario, can have unexpected effects on your data. Even if you design your experiment in a single session and leave it running for weeks, it can still be useful to see your activity on the same timeline as your data.
Whenever you edit your experiment in Convertize, you are invited to leave a note.
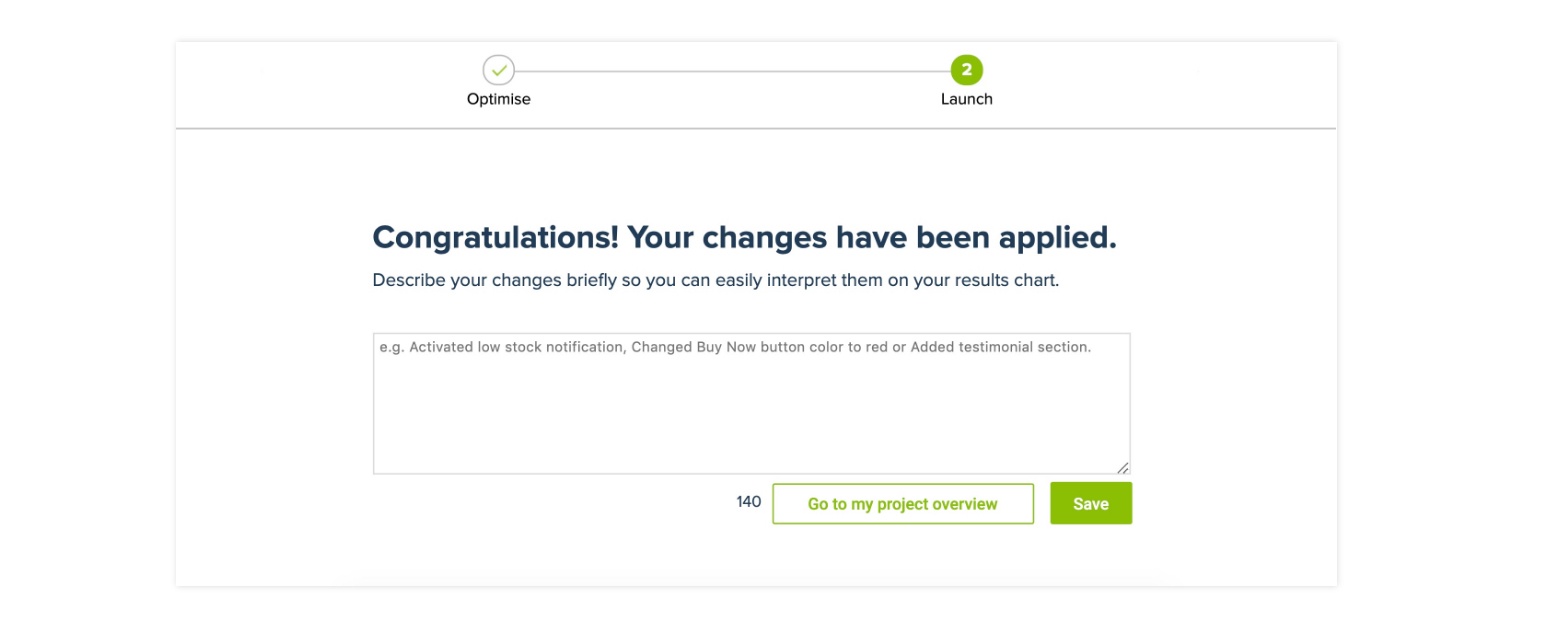
Any notes that you create are given a label and become visible on your timeline. That means you never lose track of the key moments that might have influenced your data.
Although enterprise solutions such as Optimizely allow you to add comments to your charts, they do not automate the process in the same way as Convertize. Because each of your edits creates its own annotation, Convertize makes it easier to analyse your ab test results.
The new results page now includes an Activity panel that shows you when a team member makes a change to your experiment. By clicking on the panel, you can find a detailed record of what each change involved. The panel also shows exactly when each change was made.
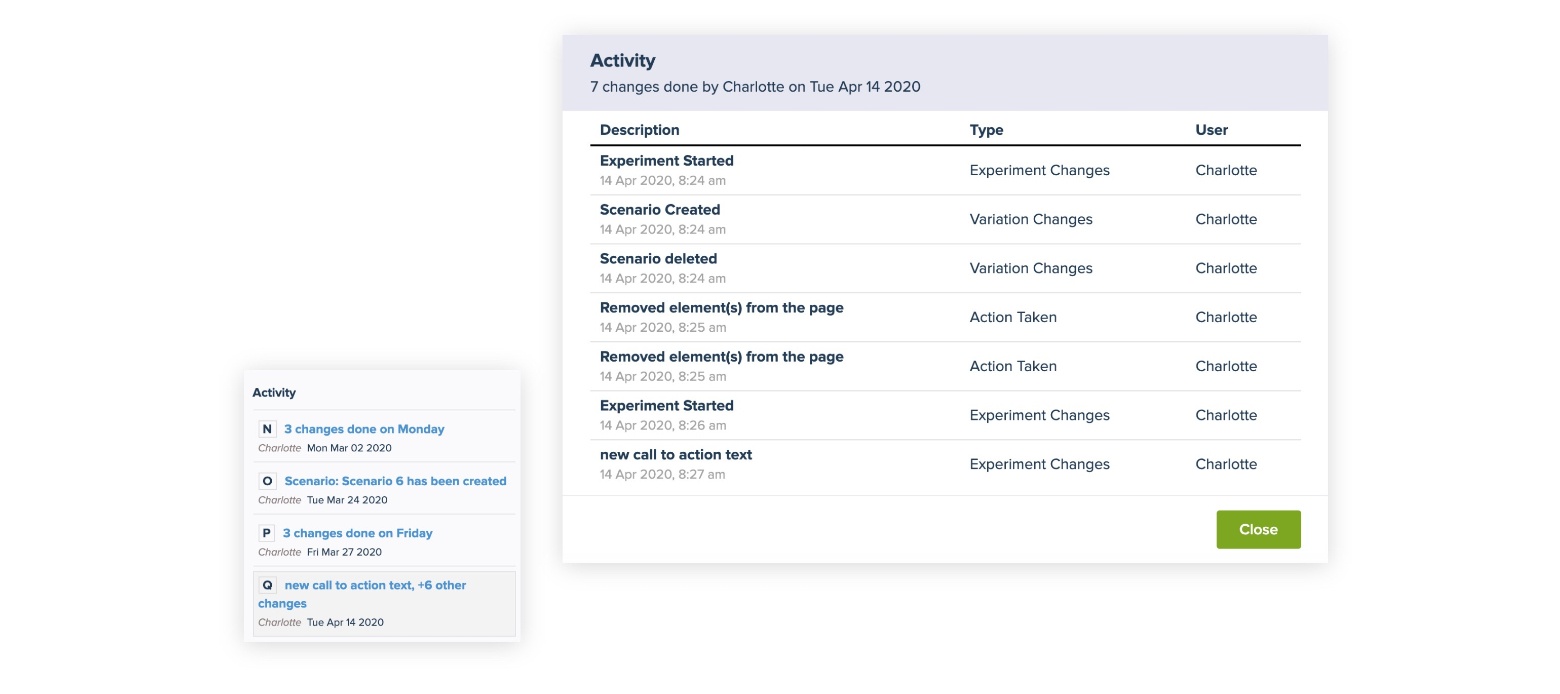
This feature is particularly useful for teams or agencies. The Activity log allows you collaborate on an experiment, and to co-ordinate your work more easily.
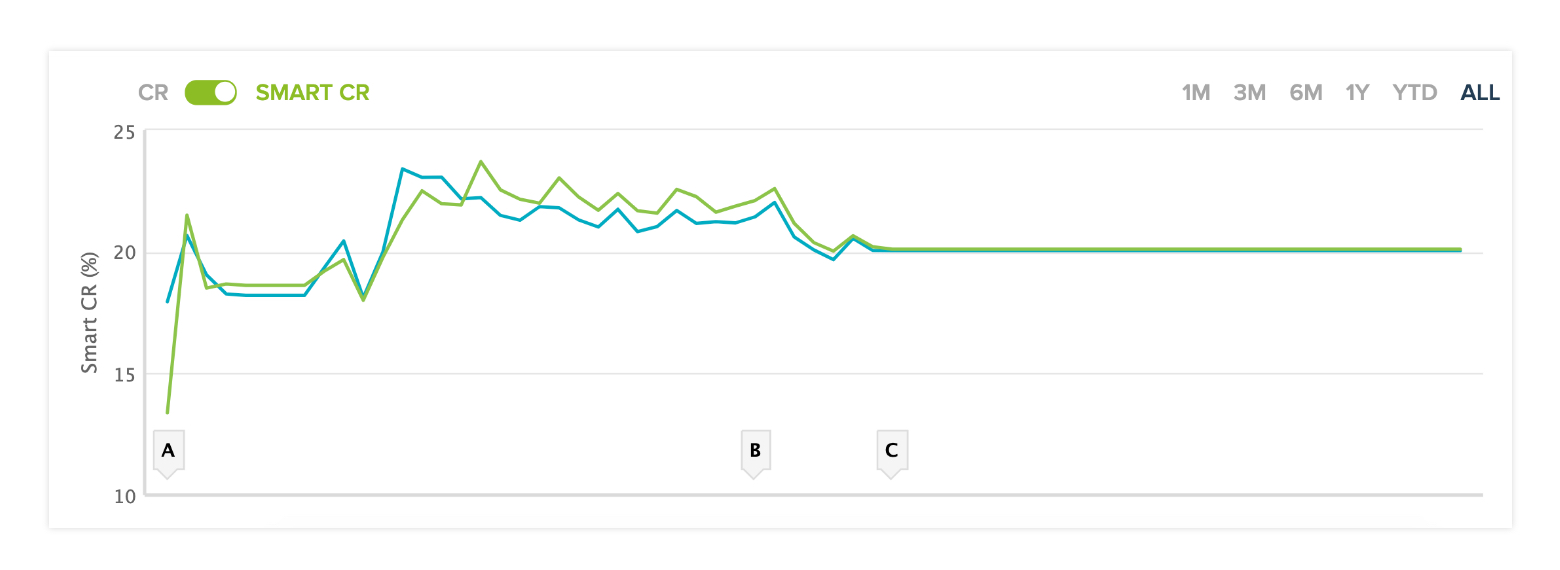
Your conversion rates change much more quickly when your page receives high numbers of visitors. Spikes in traffic are also likely to correspond to a change in the type of visitor you are receiving. In both cases, seeing your traffic alongside your conversions rates is essential to making sense of your ab test results.
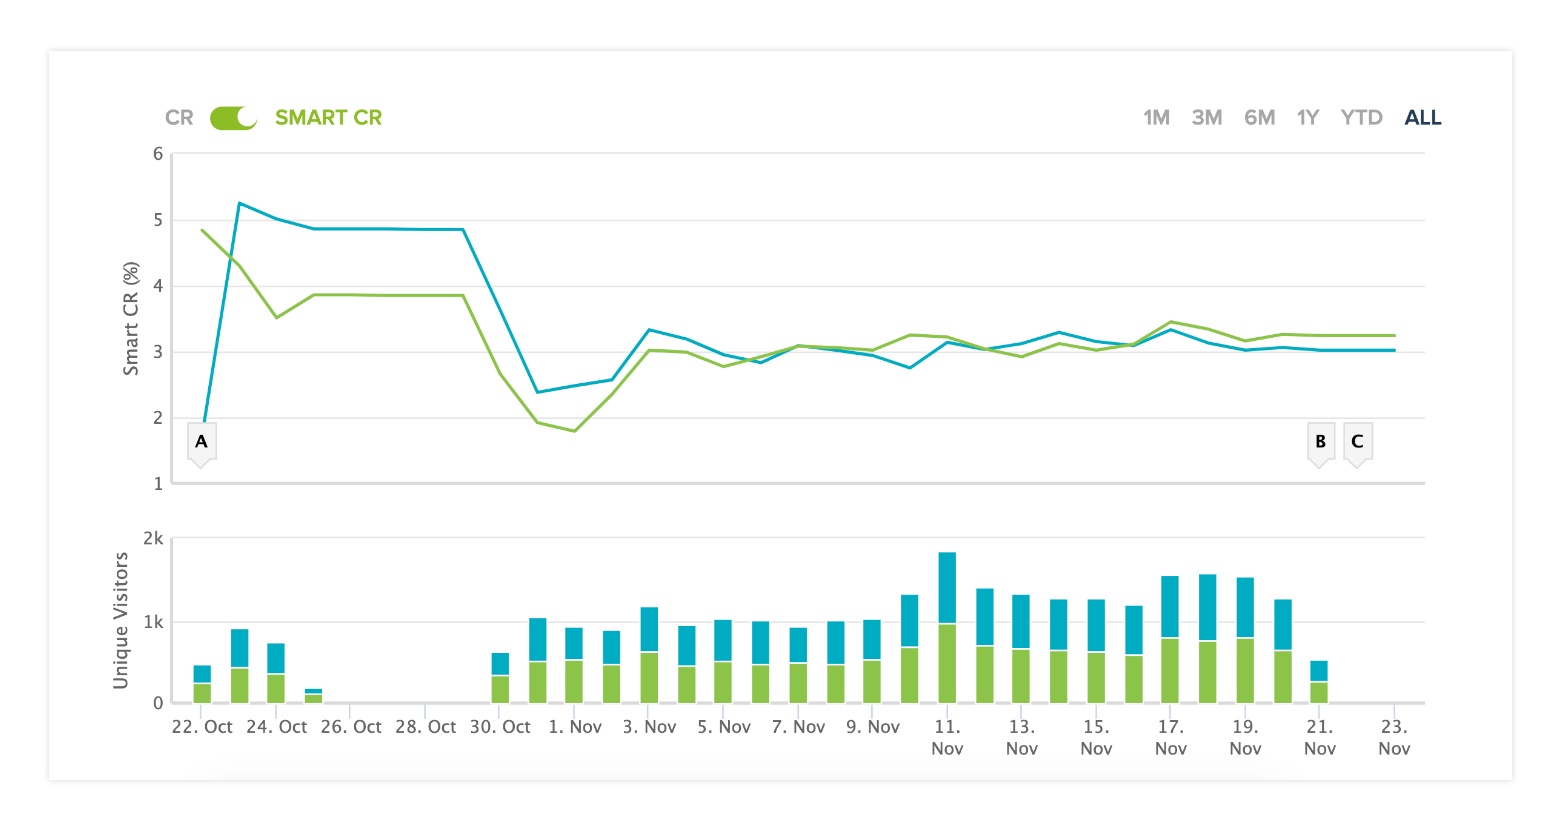
In the chart above, the Smart CR for each of the pages is significantly affected by the way traffic is distributed throughout the experiment. From the 26-30th of October, the site received very few visitors, so the Smart CR for both pages remained constant. Knowing that the traffic was especially low during this period helps to explain the false impression that one of the pages outperformed the other in the early stage of the experiment.
Similarly, the conversion rate for both pages appears to have peaked in late October, before falling and then settling at just over 3%. The traffic chart helps us to recognise that this peak was probably caused by the low number of visitors and the composition of that reduced sample. Whilst conversion rates often increase in the absence of paid traffic, because the purchase intent of direct and organic traffic is usually higher, the pages were not actually more effective at that time.
Choosing which aspects of our A/B testing tool to develop is not always straightforward. Every innovations takes time to engineer, build and test. However, what makes this process much easier is the feedback we receive from our users.
Some of our most active customers asked for new ways to explore their testing data. Others asked for new ways to manage their collaborative projects. We made it a priority and the result is, we believe, the best AB test results page available.